On this page, you will discover a curated collection of my data visualization work utilizing Excel, Tableau, and Power BI. These dashboards were made to be easy to the eyes, insightful and interactive.
I believe that effective communication of insights is key. Apart from being visually appealing, my visualizations communicates complex data in a clear and concise manner to both those in and outside the data field.

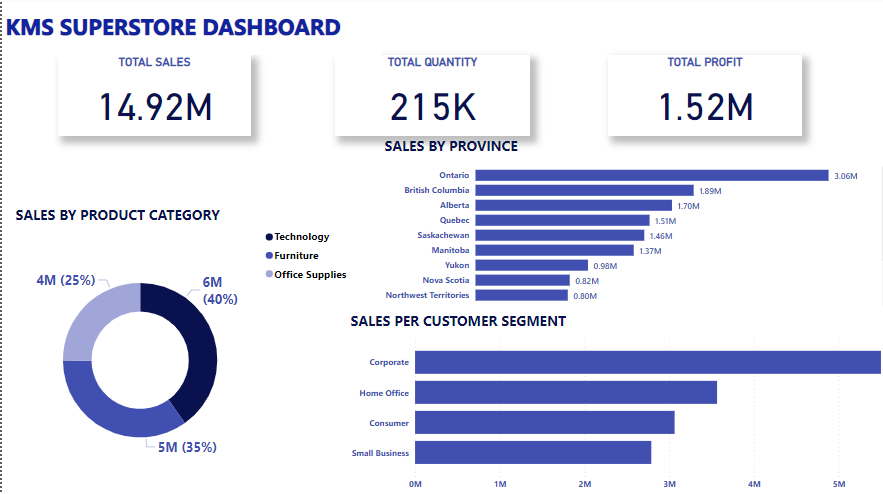
KMS Superstore Interactive Dashboard
This beautiful sales dashboard showcases the superstore's sales performance by various metrics.

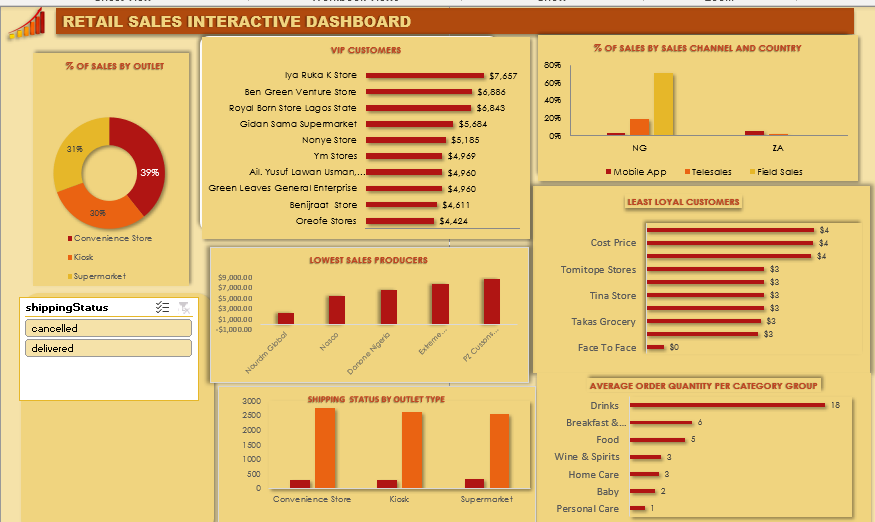
RETAIL SALES DASHBOARD
This excel dashboard enables the CMO view sales trend based on a number of different criteria, as well as customer loyalty.

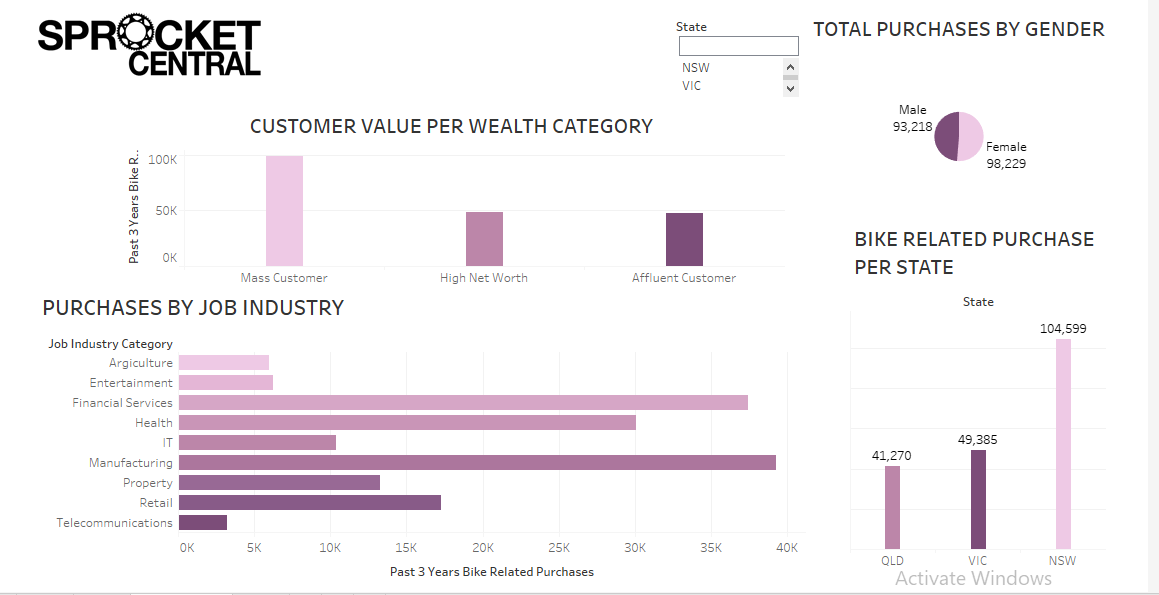
Sprocket Central pty Analytics
The Sprocket Central Analytics interactive Dashboard was designed with one goal in mind - to provide the client-a bikes & cycling accessories organisation, with real-time insights into their business performance. This dashboard allows them to easily track and analyze key metrics, including sales, marketing, and customer satisfaction, and gain a clear understanding of data trends . With this information, they can make informed decisions about their marketing strategy, including who to target out of their new customer list and which broader market segments to focus on.
Address
LagosNigeria
